

October 24, 2026 | TickerRoast Markets Analysis
Nvidia set a record on October 6. Less than three weeks later, the stock is about 12% lower, caught in a sell-off in chipmakers as investors question how the AI infrastructure boom will be financed. Yet its business is still growing at a pace few large companies have ever matched. In this TickerRoast chart breakdown, we put the fundamentals next to the price action, map the levels technical analysts are watching, and lay out what could matter next.
Key Takeaways
- Nvidia closed at $210.96 on October 23, about 11.8% below its record close of $239.24 on October 6, based on Yahoo Finance data.
- The long-term trend remains up: the 50-day moving average is above a rising 200-day average.
- In the short term, momentum is negative: the stock trades below its 20-day and 50-day averages, the MACD is below its signal line and the RSI is near its lowest level in six months.
- The $207 to $209 area, formed by the August and September lows, sits just below the current price.
- Nvidia has held up better than the semiconductor sector over the past month.
What Happened This Week
On October 22, Nvidia fell 4.4% to $212.21, according to FX Leaders, as the Philadelphia Semiconductor Index dropped 6.7% and AMD lost 8.1%. Investors grew more concerned about how long AI spending can continue at its recent pace and how it will be financed. In a CNBC interview, CEO Jensen Huang described demand from “neocloud” operators, companies that rent out GPU computing capacity, as “off the charts,” while the article noted his remarks that the capital needed to fund AI infrastructure is scarce.
The pressure extended to those GPU cloud operators. TokenPost reported that CoreWeave fell about 10%, Applied Digital 9%, IREN 8.4% and Nebius 7.2%, and estimated Nvidia’s market value at about $5.12 trillion after the decline, down from a recent high near $5.9 trillion. On Friday, October 23, Nvidia slipped a further 0.6% to $210.96, closing near the low of the session, based on Yahoo Finance data.
The Fundamentals Behind the Chart
The pullback is not explained by Nvidia’s latest results. According to the company’s second-quarter fiscal 2027 earnings release filed with the SEC on August 26, 2026:
| Metric (Q2 FY2027) | Result | Change |
|---|---|---|
| Revenue | $96.2B | +106% year over year, +18% sequentially |
| Data Center revenue | $89.0B | +117% year over year |
| Gross margin (GAAP and non-GAAP) | 75.0% | |
| Diluted EPS (GAAP / non-GAAP) | $2.46 / $2.22 | |
| Returned to shareholders | About $26.0B | Buybacks and dividends |
| Q3 FY2027 revenue outlook | $108.0B ± 2% | No China Data Center compute revenue assumed |
| Q3 FY2027 gross margin outlook | 74.0% ± 50 bps |
Huang said in the release that “AI has reached its inflection point. It’s doing useful work,” and the company reported that its Vera Rubin platform was ramping into full production with racks running at partners including Microsoft Azure, Google Cloud and Oracle Cloud Infrastructure. In our view, the market is not questioning Nvidia’s current demand; it is questioning how long its customers can keep financing purchases at this scale.
Chart 1: The Long-Term Trend Is Still Up
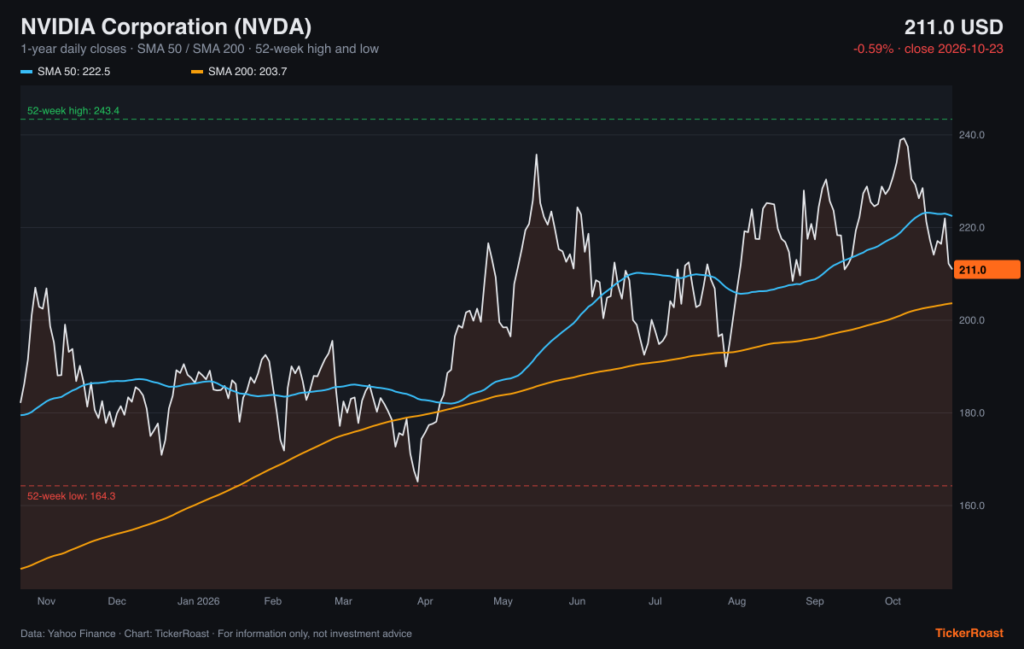
The one-year chart puts the recent drop in perspective. Based on Yahoo Finance data, Nvidia’s 52-week range runs from a low of $164.27, set on March 30, to a high of $243.37, set on October 6. At $210.96, the stock sits about 30% above its yearly low and roughly in the upper part of that range.
- 200-day moving average (about $204): the price remains above it, and the average itself has risen by about $4 over the past 20 sessions. A rising 200-day average is generally read by technical analysts as a sign that the long-term trend is intact.
- 50-day moving average (about $222): it remains well above the 200-day average, a configuration often called a “golden cross” regime. No crossover between the two has occurred over the past six months.
- The pattern since April: the stock has made a series of higher highs (about $236.5 in May, $234.8 in early September, $243.4 in October) and higher lows (about $190 in late June and July, then about $207 to $209 in August and September). Technical analysts would typically consider this structure intact as long as the price holds above the most recent higher low.
Chart 2: Short-Term Momentum Has Turned Negative
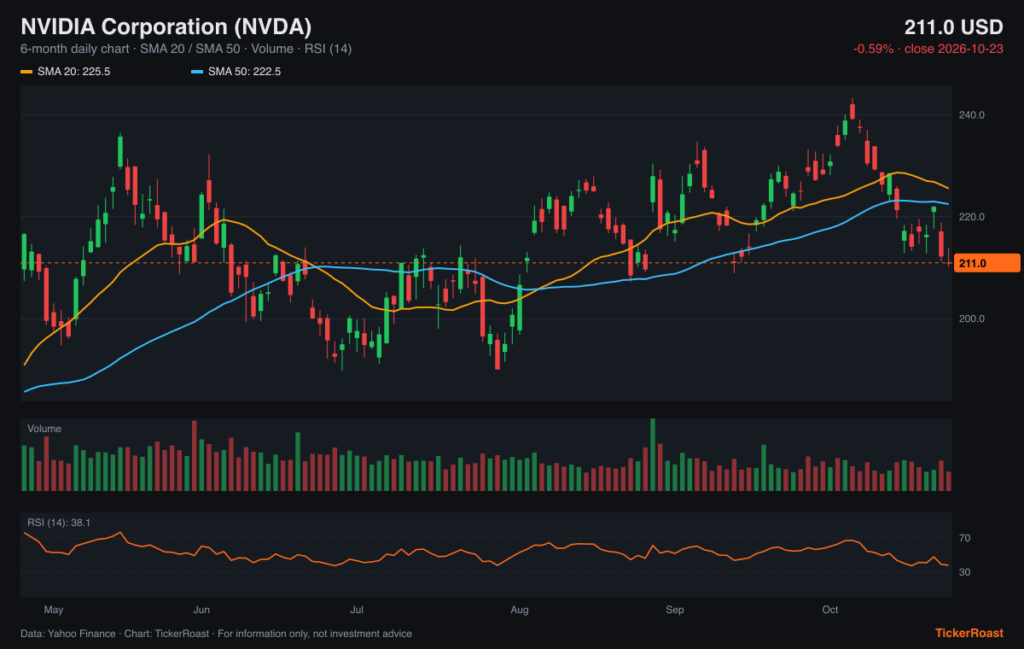
The six-month chart shows a different picture over a shorter horizon. All indicator values below are calculated from Yahoo Finance daily data as of the October 23 close.
- Moving averages: the price is below its 20-day average (about $225.5) and its 50-day average (about $222.5), and just below its 100-day average (about $214.4). The 20-day average is still above the 50-day, but it has fallen about $2.6 in five sessions, narrowing the gap to around $3.
- Candles: 14 of the past 20 sessions closed below their opening price. The October 22 session produced a long red candle on volume of about 125 million shares, above the 20-day average of about 106 million.
- Bollinger Bands (20 days, 2 standard deviations): the lower band stands near $208.5, and the stock closed close to it. Prices near the lower band reflect strong recent selling, but can stay there for some time during a decline.
- RSI (14 days): at about 38, the indicator is near its lowest reading in six months (about 37.5) but remains above 30, the level often associated with oversold conditions.
- MACD (12, 26, 9): the MACD line, at about -2.7, is below its signal line, a negative momentum reading. The histogram, however, was slightly less negative than five sessions earlier, which suggests the pace of the decline has slowed.
- Volatility: the 14-day average true range is about $6, or 2.8% of the share price per day, and annualized 20-day volatility is close to 30%.
The Levels Technical Analysts Are Watching
| Level | Type | Where it comes from |
|---|---|---|
| $243.37 | Resistance | Record intraday high, October 6 |
| About $234.8 | Resistance | Early-September swing high |
| About $225.5 | Resistance | 20-day moving average |
| About $222 | Resistance | 50-day moving average and October 21 close |
| About $218.9 | Resistance | October 22 intraday high |
| $210.96 | Last close | October 23 |
| About $207 to $209 | Support | August 24 and September 14 lows; lower Bollinger Band |
| About $204 | Support | Rising 200-day moving average |
| About $190 | Support | Late-June and late-July lows |
| $164.27 | Support | 52-week low, March 30 |
Levels are derived from Yahoo Finance daily data. FX Leaders identified a similar support zone at $208 to $210, with $200 as the next level, and resistance at $218.88, $221.97 and $243.37. Support and resistance levels are reference points used by chart analysts; they do not guarantee that prices will stop or reverse there.
How Chart Analysts Would Read the Next Moves
Technical analysis describes conditions rather than forecasts. With that caveat, here is how the current setup is commonly interpreted:
- If the $207 to $209 zone holds: the sequence of higher lows since the summer would remain intact, and the pullback would fit within the long-term uptrend shown on the one-year chart.
- If the stock closes below that zone and the 200-day average near $204: many chart readers would see the long-term trend as weakening, with the late-June and July lows near $190 as the next reference.
- If the price recovers above the 50-day average near $222: the short-term downtrend would be considered interrupted, with the September and October highs as the next references.
- A crossover of the 20-day below the 50-day average, which current slopes make possible in the coming sessions, would typically be read as confirmation of short-term weakness, but it is a lagging signal.
Chart 3: Nvidia Versus the Market and Its Peers
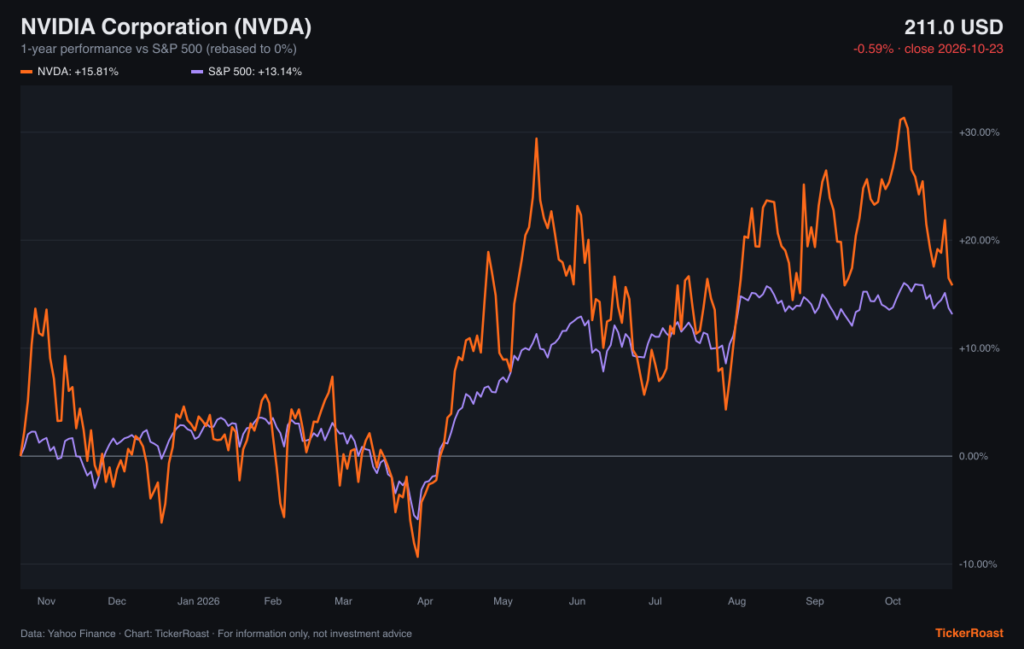
Over twelve months, Nvidia was up about 16%, compared with about 13% for the S&P 500, based on Yahoo Finance data. The relative chart shows that the stock spent most of the year moving in line with or ahead of the index, with sharper swings in both directions.
| Asset | 1-month change (to Oct. 23) |
|---|---|
| Nvidia (NVDA) | -6.1% |
| Invesco QQQ (Nasdaq-100) | -5.0% |
| Broadcom (AVGO) | -8.2% |
| Philadelphia Semiconductor Index | -13.7% |
| AMD | -17.9% |
Figures are based on Yahoo Finance data. In our view, Nvidia’s relative resilience reflects its position as the main supplier of AI accelerators with the strongest margins in the group, which tends to make it less exposed than smaller or more leveraged players when financing concerns rise.
The Roast: Bull Case vs. Bear Case
At TickerRoast, we like to put both sides on the grill. These are the arguments investors are weighing, not a recommendation.
| What bulls point to | What bears point to |
|---|---|
| Revenue up 106% and a $108B outlook for the current quarter | Concerns about how customers, especially GPU cloud operators, will finance purchases |
| Gross margin around 75% | Rising debt and funding costs at some AI infrastructure customers |
| Vera Rubin ramping into full production | Expectations are high after a large multi-year rally |
| Long-term chart still in an uptrend | Short-term momentum negative and the stock about 12% off its record |
| Analyst support, such as Cantor Fitzgerald’s Overweight rating reported by FX Leaders | No China Data Center compute revenue assumed in guidance |
Catalysts on the Calendar
- Big Tech earnings next week: Alphabet, Microsoft and Amazon report, and their AI data-center spending plans will be closely watched, according to Reuters, as published by The Spokesman-Review. These companies are among the largest buyers of AI infrastructure.
- Federal Reserve decision on Wednesday: the Fed is expected to hold rates steady, with investors watching for signals about a possible increase in December, the same report said.
- Nvidia’s third-quarter results: expected in the second half of November; dates listed by market calendars vary between November 17 and November 25, and Nvidia had not confirmed the date in the sources we reviewed.
- Financing conditions for AI cloud operators, whose shares fell sharply this week.
Key Risks
- Customer spending: any reduction in AI capital spending plans by large customers would affect future demand.
- Customer financing: GPU cloud operators rely partly on debt to fund purchases.
- China and export rules: guidance excludes China Data Center compute revenue, and policy changes remain possible.
- Volatility: with daily moves averaging close to 3%, the stock can swing sharply on news.
- Concentration of expectations: as one of the world’s most valuable companies, Nvidia carries a large weight in major indexes, which can amplify market-wide moves.
Conclusion
Nvidia’s charts tell two stories at once. Over one year, the trend is still up, supported by a rising 200-day average and a business that more than doubled its revenue. Over the past three weeks, momentum has turned negative as worries about AI financing hit the entire chip sector, bringing the stock close to the $207 to $209 support zone. Next week’s Big Tech earnings and Nvidia’s own results in November should show whether this pullback stays within the long-term uptrend or marks a deeper change in sentiment. Neither outcome can be known in advance.
Sources
- NVIDIA Announces Financial Results for Second Quarter Fiscal 2027 (Form 8-K, Exhibit 99.1) — SEC EDGAR / NVIDIA
- Nvidia NVDA Stock Falls 4.4% to $212.21 as AI Financing Fears Hit Chips — FX Leaders
- Nvidia Shares Fall 4.4% as Semiconductor Index Drops 6.8% — TokenPost
- Dow, S&P 500 fall, tech steadies to end rocky week — Reuters, via The Spokesman-Review
Market data: Yahoo Finance, close of 2026-10-23. Charts generated by TickerRoast from this data.
Disclaimer: This article is for informational and educational purposes only. It provides general financial and business analysis and does not constitute investment advice, a personal recommendation, a recommendation to buy, sell or hold any security, or an offer to transact in any financial instrument. Information is based on publicly available sources as of October 24, 2026 and market data as of the 2026-10-23 close (Yahoo Finance). Past performance is not a reliable indicator of future results; forecasts are uncertain and actual results may differ materially. Investing in shares involves risk, including the loss of capital. The publisher does not guarantee the accuracy or completeness of the information and accepts no responsibility for investment decisions made on the basis of this article. Readers should consult official company disclosures, conduct their own research and, where appropriate, seek advice from a licensed financial adviser. Any relevant financial interests held by the author or publisher in the securities mentioned are disclosed where applicable. This article was prepared with the assistance of AI tools and is based on the sources listed above.
Related reading
- Nasdaq Suffers Its Worst Day Since June: Is This a Market Correction?
- The Week That Could Decide the AI Trade: My Notes Before the Fed and Big Tech Earnings
- Western Digital Stock: Q1 Revenue Jumps 55% as AI Storage Demand Lifts Results and Guidance
Anonymous reader poll, just for fun. Not investment advice.
Read next
Get the daily market briefing
The stories that move markets, in your inbox every trading day at 9 a.m. ET. Free, unsubscribe anytime.