

October 29, 2026 | TickerRoast Markets Analysis
Thursday morning’s data gave both sides of the Fed debate something to point to. The economy grew faster in the third quarter than in the second, which supports the Fed’s new description of a strong expansion. But the Fed’s preferred inflation gauge rose 3.6% from a year earlier in September, and households barely increased their spending in real terms. Coming the day after two policymakers voted for a rate hike, I read the mix as keeping that option firmly on the table.
Growth Accelerates to 3.4%
According to the Bureau of Economic Analysis advance estimate, real GDP grew at a 3.4% annual rate in the third quarter, up from 2.2% in the second. Investment, consumer spending and government spending all contributed, partly offset by a drop in exports, while imports rose. The acceleration mainly reflected faster investment and an upturn in government spending. Real final sales to private domestic purchasers, which strip out trade, inventories and government and are a good read on underlying private demand, rose 4.9% after 4.6%.
The quarterly inflation readings in the GDP report looked benign: the PCE price index rose at a 2.1% annual rate in the third quarter and 2.5% excluding food and energy, down from 5.0% and 3.3% in the second quarter. Those are quarter-over-quarter annualized rates, though, and the monthly report released at the same time tells a less comfortable story about where the quarter ended.
September Ended the Quarter Hot
The September personal income and outlays report shows the PCE price index up 0.5% on the month and 3.6% from a year earlier. Excluding food and energy, prices rose 0.3% on the month and 3.1% over twelve months. That lines up with the 3.7% consumer price inflation reported for September, where gasoline drove more than half of the monthly increase.
The household picture is the weak spot. Nominal consumer spending rose 0.5% in September, but after inflation real spending was essentially flat, and real disposable income fell 0.3%. The personal saving rate stood at 3.8%. Put simply, higher prices absorbed September’s income gains, which is the kind of squeeze that can slow consumption later even when the quarterly GDP figure looks strong.
What It Means After Wednesday’s Fed Meeting
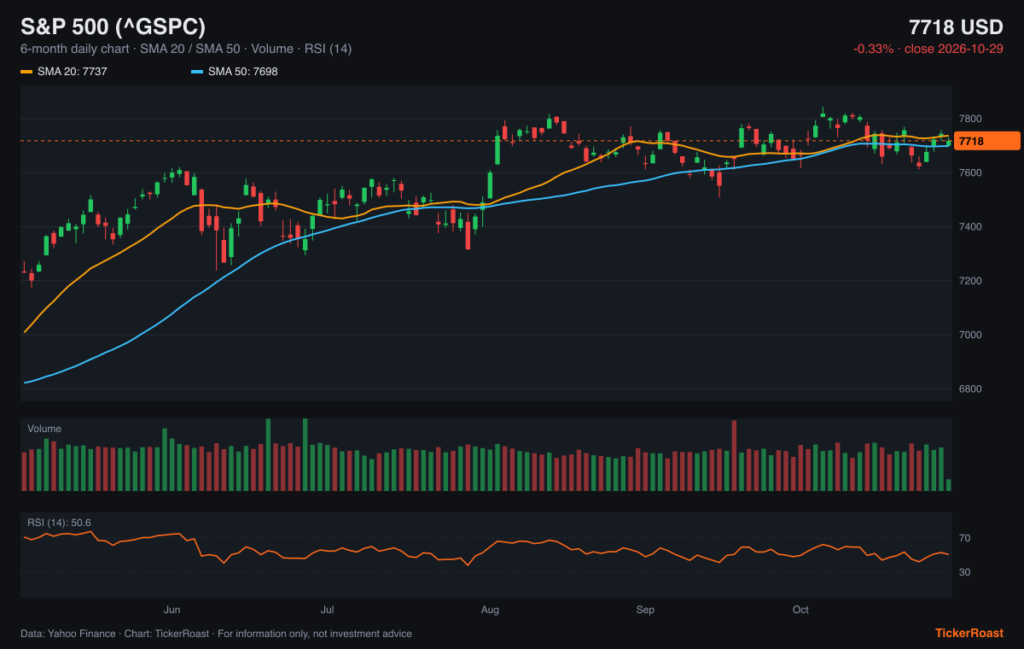
On Wednesday the Federal Reserve held its target range at 3.75% to 4%, with Lisa Cook and Beth Hammack dissenting in favor of a quarter-point hike, and upgraded its description of growth from solid to strong. Thursday’s numbers confirm that assessment of growth and show inflation still well above the 2% goal. Bond markets took the data calmly: the 10-year Treasury yield slipped to just under 5% by early afternoon, based on Yahoo Finance data. The next GDP estimate and the October income and spending report are both scheduled for Nov. 25.
Sources
- Gross Domestic Product (Advance Estimate), 3rd Quarter 2026 — U.S. Bureau of Economic Analysis
- Personal Income and Outlays, September 2026 — U.S. Bureau of Economic Analysis
- Consumer Price Index, September 2026 — U.S. Bureau of Labor Statistics
- Federal Reserve issues FOMC statement (Oct. 28, 2026) — Board of Governors of the Federal Reserve System
- 10-year Treasury yield — Yahoo Finance
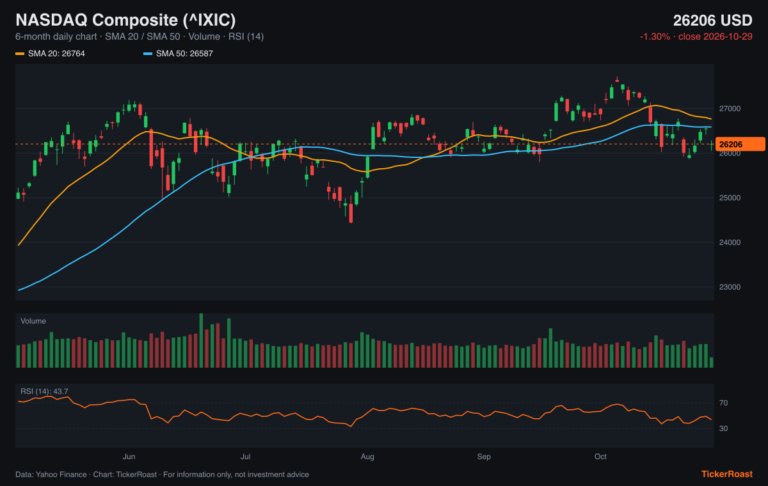
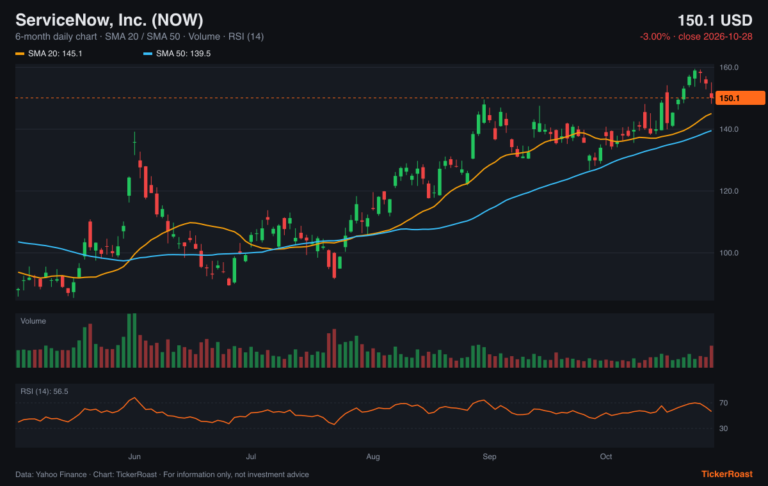
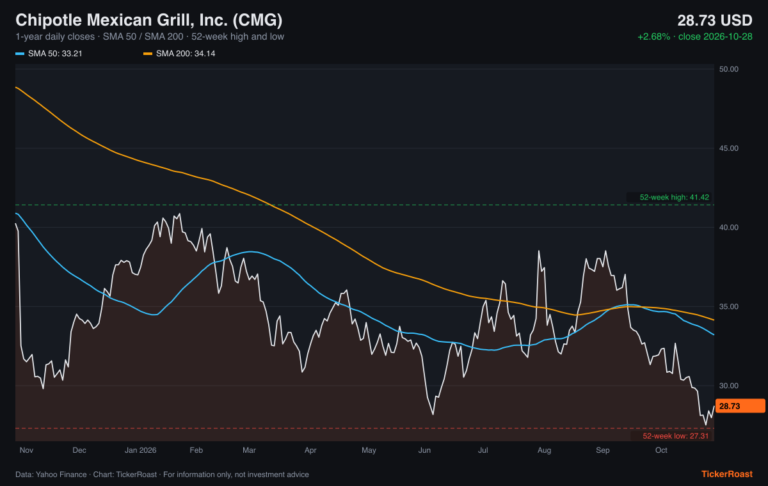
Market data: Yahoo Finance, close of 2026-10-29. Charts generated by TickerRoast from this data.
Disclaimer: This article is for informational and educational purposes only. It provides general financial and business analysis and does not constitute investment advice, a personal recommendation, a recommendation to buy, sell or hold any security, or an offer to transact in any financial instrument. Information is based on publicly available sources as of October 29, 2026 and market data as of the 2026-10-29 close (Yahoo Finance). Past performance is not a reliable indicator of future results; forecasts are uncertain and actual results may differ materially. Investing in shares involves risk, including the loss of capital. The publisher does not guarantee the accuracy or completeness of the information and accepts no responsibility for investment decisions made on the basis of this article. Readers should consult official company disclosures, conduct their own research and, where appropriate, seek advice from a licensed financial adviser. Any relevant financial interests held by the author or publisher in the securities mentioned are disclosed where applicable. This article was prepared with the assistance of AI tools and is based on the sources listed above.
Anonymous reader poll, just for fun. Not investment advice.
Read next
Get the daily market briefing
The stories that move markets, in your inbox every trading day at 9 a.m. ET. Free, unsubscribe anytime.