

October 25, 2026 | TickerRoast Markets Analysis
Ask people around you which is safer, an apartment or a portfolio of shares, and most will answer without hesitation: the apartment. You can live in it, rent it out, touch it, and its price never collapses on a screen. Yet when I look at the data and at how risk is actually measured, that intuition rests on an optical illusion. Property is not riskless and stocks are not a casino. They carry different kinds of risk, and one of them is simply easier to see.
What 145 Years of Data Say About Returns
The most comprehensive study on the subject, “The Rate of Return on Everything, 1870–2015” by Òscar Jordà, Katharina Knoll, Dmitry Kuvshinov, Moritz Schularick and Alan M. Taylor, published in the Quarterly Journal of Economics in 2019, covers 16 advanced economies. According to the authors’ summary in the NBER Reporter, real total returns on housing and on equities were on par with each other, at about 7% per year on average, while real returns on government bonds and bills were mostly in the 1% to 3% range.
That result surprises people in both directions. It shows that stocks have not been a reckless bet over the long run, and it also shows that housing has been a genuinely productive asset. The key word, however, is total: the figure combines price changes and rental income, before the many costs that an individual owner bears.
Most of Property’s Return Comes From Rent, Not Prices
Many owners judge their investment by comparing the price they paid with the price they could get today. Long-run price data tell a sobering story. Using Robert Shiller’s U.S. home price series, which goes back to 1890, Ben Carlson of A Wealth of Common Sense calculated that real home prices rose only about 13% in total between 1890 and 1996, roughly 0.1% per year after inflation. Prices then jumped more than 70% in real terms between 1997 and 2006, fell about 35% to a bottom in 2012, and have risen sharply since. Economists have noted that the early part of the series is a rough reconstruction, but the broad message is widely accepted.
Put those two findings together and the mechanics become clear: over the long run, house prices have broadly tracked inflation, while most of the real return of housing has come from the rent it generates, or the rent an owner-occupier no longer has to pay. That rent is a gross figure. Property taxes, insurance, maintenance, renovations, vacancies and borrowing costs all reduce it, and, as Carlson put it, “most people underestimate all of the ancillary costs involved.”
The Price You Never See Is Still a Risk
This is the heart of the misconception. A listed share is priced every second, so every fall is visible. A house is valued only when it is sold or appraised, perhaps once every few years. Between those moments, its value moves too, but nobody sees it. The absence of a daily price creates an impression of stability that has nothing to do with the underlying risk.
Investment professionals have a name for this effect. AQR co-founder Cliff Asness coined the term “volatility laundering” for the practice of not marking private assets to market, according to the CFA Institute’s Enterprising Investor blog. Appraisal-based values tend to lag market prices and smooth out swings, so private assets can look far less volatile on paper than they really are.
What Real Estate Looks Like When It Is Priced Every Day
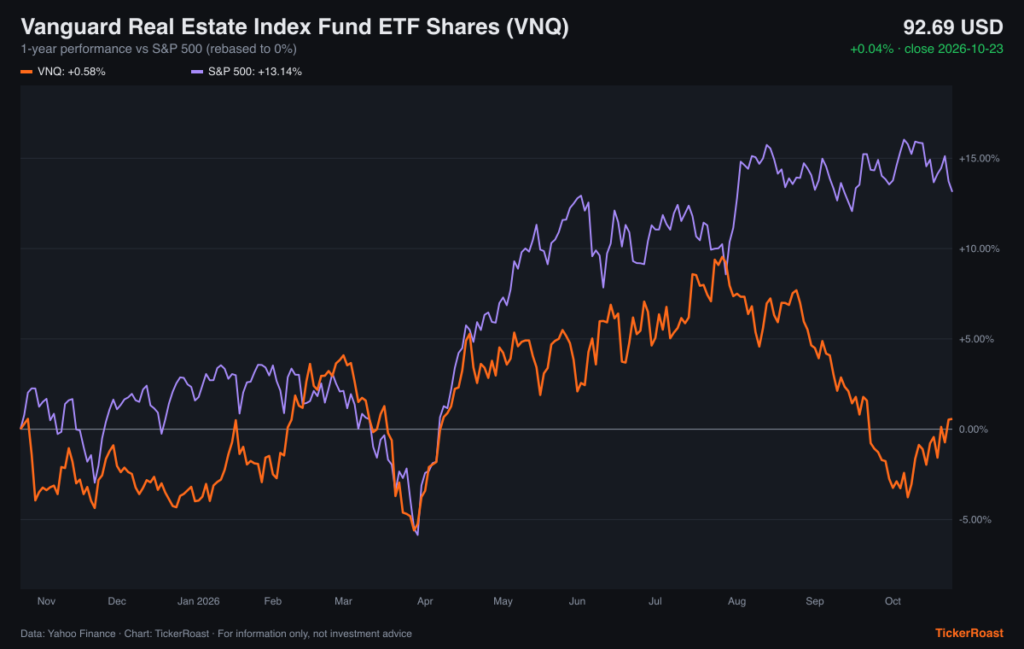
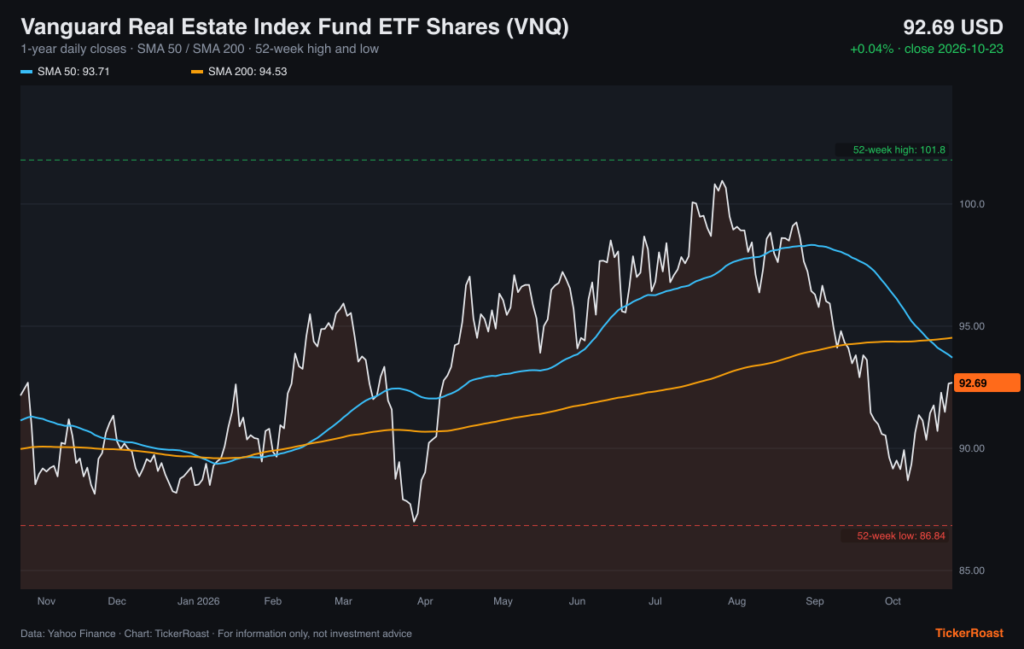
There is a simple way to test the illusion: look at real estate that does trade daily. Real estate investment trusts (REITs) own office buildings, apartments, warehouses and shopping centers, and their shares are listed on the stock market. The Vanguard Real Estate ETF (VNQ), which holds a broad basket of them, is a useful proxy.
| Measure (calculated from Yahoo Finance data) | U.S. listed real estate (VNQ) | S&P 500 |
|---|---|---|
| Annualized volatility, past 12 months | 14.1% | 12.7% |
| Largest peak-to-trough decline, past 2 years | -19.1% | -18.9% |
| Price change, past 12 months (to Oct. 23, 2026) | +0.6% | +13.1% |
When real estate is priced continuously, its volatility over the past year was slightly higher than that of the S&P 500, and its worst decline over two years was almost identical. The price changes exclude dividends, which are significant for REITs, so they understate total returns. The point is not that one asset beat the other over a short period, but that once you can see the price of property every day, it moves very much like the rest of the market.
Leverage: The Risk Hidden in the Mortgage
The second reason property feels safe is, paradoxically, the one that makes it riskier for most households: borrowing. Very few people buy a home outright. A mortgage multiplies both gains and losses on the money actually invested. Take a simple, purely illustrative example of a $300,000 property bought with a $60,000 down payment and a $240,000 loan.
| Change in property value | Value of the owner’s equity | Change on the $60,000 invested |
|---|---|---|
| +10% ($330,000) | $90,000 | +50% |
| 0% ($300,000) | $60,000 | 0% |
| -10% ($270,000) | $30,000 | -50% |
| -20% ($240,000) | $0 | -100% |
Illustrative figures before transaction costs, interest and loan repayments. With 5-to-1 leverage, a 20% decline in the property’s value is enough to erase the entire down payment, while the same 20% decline in an unleveraged stock portfolio means a 20% loss. The U.S. experience after 2006, when real home prices fell by about a third, showed that this is not a theoretical scenario: many owners ended up owing more than their homes were worth.
One Address Versus Hundreds of Companies
The third difference is concentration. An individual property investor typically owns one or two assets, in one city, sometimes in one building. Its value depends on a local job market, a neighborhood, a single tenant or a single roof. A broad stock index fund, by contrast, spreads money across hundreds of companies, sectors and often countries. Even the authors of the 145-year study acknowledged that housing portfolios are “more difficult to diversify than equity portfolios” and that transaction costs are “admittedly higher,” according to the NBER Reporter. Their 7% figure describes national housing markets, not the experience of a single owner with a single property.
Liquidity follows the same logic. Shares in a large index fund can be sold in seconds at a known price. A property can take months to sell, at a price that is only discovered at the end of the process, and with fees and taxes that can absorb several years of price gains. Illiquidity does not show up in volatility statistics, but it is a real cost when money is needed quickly.
How to Compare the Two Fairly
A fair comparison has to look at the same things on both sides: total return including income, after all costs and taxes; the same level of borrowing; and risk measured the same way, with prices marked at the same frequency. Most informal comparisons fail on all three counts, setting a leveraged property’s price gain, before costs and without regular valuation, against an unleveraged stock portfolio watched on a screen every day.
| Characteristic | Direct property ownership | Diversified stock index fund |
|---|---|---|
| Main source of return | Rent (or rent saved), then price changes | Company earnings, through dividends and price changes |
| How often the price is visible | Rarely, at sale or appraisal | Continuously |
| Typical leverage for individuals | High (mortgage) | Usually none |
| Diversification | Low: one or a few assets | High: hundreds of companies |
| Liquidity | Low: months to sell | High: seconds to sell |
| Running costs | Taxes, insurance, maintenance, vacancies | Fund fees, generally low |
| Use value | Can be lived in | None |
Where Real Estate Genuinely Stands Apart
None of this makes property a poor asset. The long-run evidence shows strong total returns, and the 145-year study found that housing returns have remained largely uncorrelated across countries, while equity markets have become more synchronized. A home also provides something no share does: a place to live, protection against rising rents and, for many households, a form of disciplined saving through mortgage repayments. Those are real advantages. They are simply different from being free of risk. The risk of a property is local, leveraged and invisible until the day it is sold, while the risk of a diversified stock portfolio is broad, unleveraged and displayed every day. Confusing “I can’t see the risk” with “there is no risk” is the mistake worth avoiding, whichever asset one chooses.
Sources
- The Rate of Return on Everything (NBER Reporter, 2018 No. 4) — National Bureau of Economic Research
- The Rate of Return on Everything, 1870–2015 (Working Paper 24112) — National Bureau of Economic Research
- Is Housing a Good Investment? — A Wealth of Common Sense (Ben Carlson)
- Volatility Laundering: Public Pension Funds and the Impact of NAV Adjustments — CFA Institute, Enterprising Investor
Market data: Yahoo Finance, close of 2026-10-23. Charts generated by TickerRoast from this data.
Disclaimer: This article is for informational and educational purposes only. It provides general financial and business analysis and does not constitute investment advice, a personal recommendation, a recommendation to buy, sell or hold any security, or an offer to transact in any financial instrument. Information is based on publicly available sources as of October 25, 2026 and market data as of the 2026-10-23 close (Yahoo Finance). Past performance is not a reliable indicator of future results; forecasts are uncertain and actual results may differ materially. Investing in shares involves risk, including the loss of capital. The publisher does not guarantee the accuracy or completeness of the information and accepts no responsibility for investment decisions made on the basis of this article. Readers should consult official company disclosures, conduct their own research and, where appropriate, seek advice from a licensed financial adviser. Any relevant financial interests held by the author or publisher in the securities mentioned are disclosed where applicable. This article was prepared with the assistance of AI tools and is based on the sources listed above.
Related reading
- Why Investing Is Essential to Achieving Financial Freedom
- Stock Market Week in Review: Oil Above $116, Tech Sell-Off and a Fed Meeting Ahead
- Nasdaq Suffers Its Worst Day Since June: Is This a Market Correction?
Anonymous reader poll, just for fun. Not investment advice.
Read next
Get the daily market briefing
The stories that move markets, in your inbox every trading day at 9 a.m. ET. Free, unsubscribe anytime.