

October 25, 2026 | TickerRoast Markets Analysis
On Thursday, Moderna lost almost a fifth of its value in a single session after early results from its melanoma vaccine leaked online. On Saturday, the full data were presented on the main stage of Europe’s largest cancer congress. I spent the weekend going through them, and I came away with a more nuanced view than the one the market expressed on Thursday.
The Numbers Behind the Headline
Moderna and Merck presented the Phase 3 INTerpath-001 trial at the ESMO 2026 Presidential Symposium in Madrid on October 24. According to CancerNetwork, the study enrolled 1,137 patients with high-risk melanoma that had been completely removed by surgery. They received either intismeran, the personalized mRNA vaccine, plus Merck’s Keytruda, or Keytruda alone. The results have also been accepted for publication in The New England Journal of Medicine.
| Measure (vaccine + Keytruda vs Keytruda alone) | Result |
|---|---|
| Risk of recurrence or death (primary endpoint) | 42% lower (HR 0.58) |
| Patients free of recurrence after 2 years | 82.2% vs 70.0% |
| Risk of distant metastasis or death | 38% lower (HR 0.62) |
| Patients free of distant metastasis after 2 years | 88.5% vs 80.2% |
| Overall survival | Not yet mature; favorable trend reported |
| Severe treatment-related side effects (grade 3–5) | 14.2% vs 13.4% |
The figure I keep coming back to is the gap after two years: about 82 out of 100 patients were still free of recurrence with the combination, compared with 70 with Keytruda alone. In a setting where Keytruda is already the standard of care, that is a meaningful difference. Trial principal investigator Georgina Long described the results as a potential “foundational shift” in treating earlier-stage melanoma, according to CancerNetwork.
The Detail Most Headlines Skipped
What I found most interesting was hidden in the timing. During the first six months, there was no difference between the two groups: the hazard ratio was 0.99, essentially identical. After six months, once the vaccine regimen was completed, the benefit became much stronger, with a hazard ratio of 0.42 in a prespecified analysis, according to CancerNetwork. In plain terms, the vaccine seems to need time to train the immune system, and its effect appears to build after the treatment period.
I read this two ways. On the positive side, a delayed but growing effect is consistent with how a vaccine is expected to work, and it could mean the curves keep separating with longer follow-up. On the cautious side, overall survival, the measure regulators and doctors ultimately care most about, is still immature. Side effects were also more frequent overall, with 95.8% of patients reporting a treatment-related event in the combination group versus 90.0%, mostly fever, injection-site pain and fatigue, although severe events were similar.
Why the Stock Fell on Good News

The one-year chart explains the market’s reaction better than any press release. Based on Yahoo Finance data, Moderna was up more than 500% since January before Thursday’s drop, after starting the year near $30. When a stock has run that far ahead of a catalyst, good news is often not enough. Reuters reported, via Yahoo Finance, that the October 22 sell-off erased about $24 billion of market value, with analysts at UBS and William Blair describing it as a classic sell-the-news reaction.
Based on Yahoo Finance data, the stock closed at $202.63 on October 22, down 17.6%, and slipped a further 1.3% to $200.10 on Friday, before the full presentation. That means Monday’s session will be the first chance for the market to react to the complete data set, including the stronger effect after six months.
What I’m Watching on the Chart
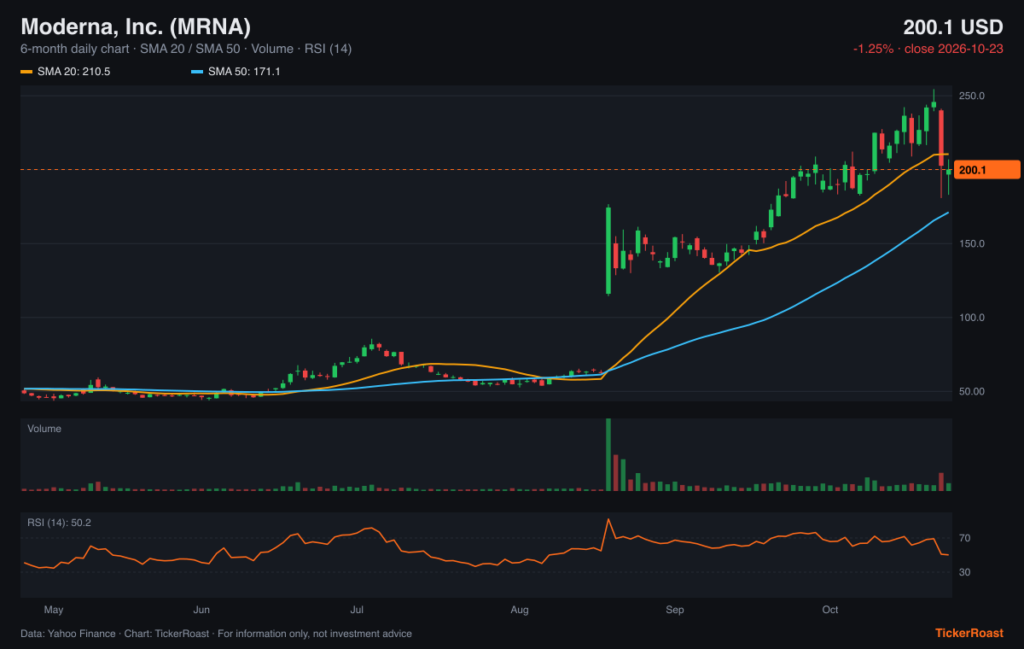
On the six-month chart, Moderna now sits just below its 20-day moving average, around $210, but far above its 50-day average near $171 and its 200-day average near $82. The 14-day RSI has cooled to about 50, a neutral reading after weeks in overbought territory. The October 22 candle is the one I would keep in mind: a gap from about $246 down to an intraday low near $181, on volume close to three times normal. In my experience, levels like these tend to become reference points when a stock digests a major event.
The Questions That Still Matter
For me, three questions now outweigh the headline result. The first is overall survival, which will take more time. The second is regulation: the companies say they are engaging with regulators, but no filing timeline has been disclosed. The third is whether the approach works beyond melanoma, a question William Blair’s Myles Minter raised according to Reuters, and one that matters a great deal for a company whose valuation has risen this much. Intismeran remains an investigational treatment, and none of these answers will arrive overnight.
Merck, Moderna’s partner, closed Friday at $145.27, based on Yahoo Finance data. Its reaction on Monday will also be worth watching, since the vaccine is designed to be used alongside Keytruda, Merck’s most important product.
Sources
- Intismeran Plus Pembrolizumab Reduces Recurrence Risk in Resected Melanoma — CancerNetwork
- Moderna sheds about $24 billion as cancer vaccine data triggers ‘sell-the-news’ retreat (Reuters) — Yahoo Finance / Reuters
Market data: Yahoo Finance, close of 2026-10-23. Charts generated by TickerRoast from this data.
Disclaimer: This article is for informational and educational purposes only. It provides general financial and business analysis and does not constitute investment advice, a personal recommendation, a recommendation to buy, sell or hold any security, or an offer to transact in any financial instrument. Information is based on publicly available sources as of October 25, 2026 and market data as of the 2026-10-23 close (Yahoo Finance). Past performance is not a reliable indicator of future results; forecasts are uncertain and actual results may differ materially. Investing in shares involves risk, including the loss of capital. The publisher does not guarantee the accuracy or completeness of the information and accepts no responsibility for investment decisions made on the basis of this article. Readers should consult official company disclosures, conduct their own research and, where appropriate, seek advice from a licensed financial adviser. Any relevant financial interests held by the author or publisher in the securities mentioned are disclosed where applicable. This article was prepared with the assistance of AI tools and is based on the sources listed above.
Related reading
- Why Did Moderna Stock Plunge 18% on Positive Cancer Vaccine Data? Inside the Sell-the-News Reversal
- Sensorion Shares Jump 22% to €9.61 as Medical Leadership Appointment Draws Attention
- Trump’s ‘Everybody Gets Healthcare’ Clip Goes Viral Again: What Health Insurer Stocks Are Saying
Anonymous reader poll, just for fun. Not investment advice.
Read next
Get the daily market briefing
The stories that move markets, in your inbox every trading day at 9 a.m. ET. Free, unsubscribe anytime.