

October 29, 2026 | TickerRoast Markets Analysis
Fortinet beat estimates on revenue and earnings, raised its full-year revenue and billings outlook and added $1.2 billion to its buyback. The stock still fell about 26% after hours, the steepest reaction in a busy night of earnings. The explanation lies in one line of the guidance and in how far the shares had run.
Every Headline Number Beat
According to Fortinet’s third-quarter press release, revenue grew 20% to $2.08 billion, product revenue rose 37% to $765 million and billings climbed 29% to $2.34 billion. Non-GAAP earnings were $0.91 per share and GAAP earnings $0.86. SiliconANGLE reports that analysts expected $0.86 in adjusted earnings per share on revenue of $2.06 billion. The company generated $946 million of operating cash flow and $865 million of free cash flow, and increased its share repurchase authorization by $1.2 billion, leaving $2 billion available.
The shares fell 25.6% in after-hours trading, according to Investing.com, after a decline of nearly 6% in the regular session. Stock Titan put the drop at 26.2% at 6:02 p.m. Eastern.
The Service Line Tells a Different Story
The tension is between product and service. Product revenue, which reflects firewall hardware sales, grew 37% from $559.3 million a year earlier. Service revenue, the recurring subscriptions and support that investors value most, rose about 13% to $1,313.4 million from $1,165.6 million. The full-year guide makes that gap more visible. Fortinet now expects 2026 service revenue of $5.150 billion to $5.170 billion, down from the $5.180 billion to $5.220 billion it guided in its second-quarter release in July.
| 2026 guidance | July (Q2 release) | October (Q3 release) |
|---|---|---|
| Revenue | $8.020B – $8.180B | $8.125B – $8.215B |
| Service revenue | $5.180B – $5.220B | $5.150B – $5.170B |
| Billings | $9.350B – $9.550B | $9.568B – $9.718B |
| Non-GAAP operating margin | 35.0% – 37.0% | 36.5% – 37.5% |
| Non-GAAP EPS | $3.41 – $3.47 | $3.54 – $3.58 |
So total revenue, billings, margin and earnings guidance all went up, while the most valuable piece of revenue went down. For a company whose valuation increasingly depends on the recurring part of its business, I can see why investors fixated on that line. The strong product cycle is welcome, but hardware refresh revenue is lumpier and harder to extrapolate than subscriptions.
Growth Is Decelerating From a High Base
The second issue is the pace of growth. In the second quarter, Fortinet reported revenue growth of 26% and product growth of 52%, according to its July release. This quarter, those figures were 20% and 37%. SiliconANGLE cites Benzinga’s view that investors appear to be hung up on revenue growth and guidance. It also notes the shares had more than doubled this year, which leaves very little room for anything short of an acceleration.
For the fourth quarter, Fortinet guided revenue to $2.155 billion to $2.245 billion, billings to $2.775 billion to $2.925 billion and non-GAAP earnings per share to $0.93 to $0.95. SiliconANGLE did not provide consensus figures for these ranges, so I cannot say whether they fell short of expectations.
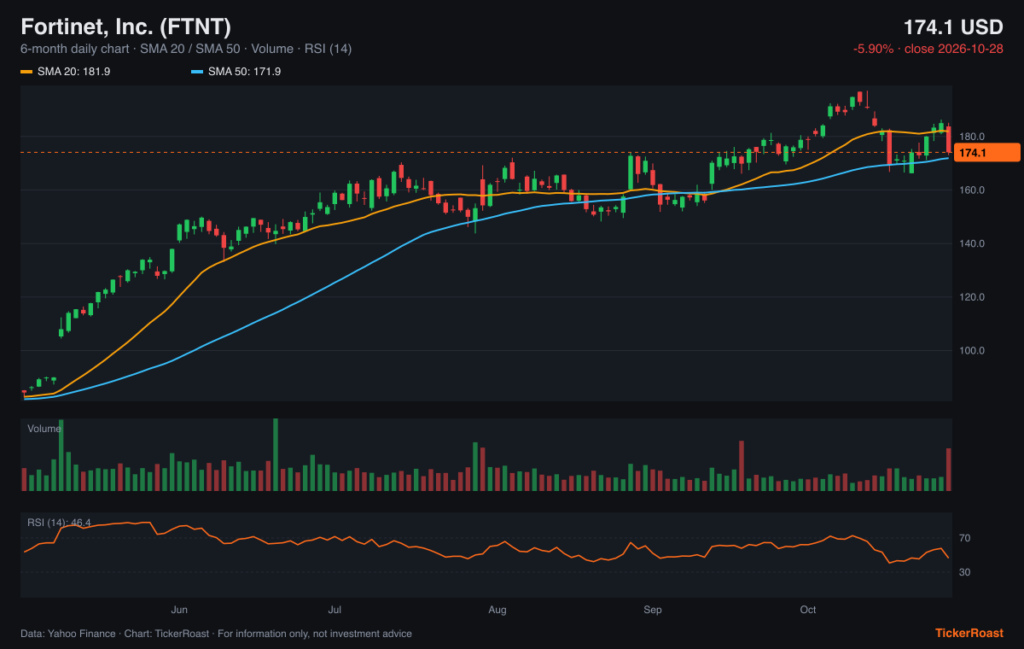
The chart above shows Fortinet’s six-month price action, moving averages, volume and RSI through Wednesday’s regular-session close. It does not include the after-hours drop, which would put the shares well below the levels shown. Fortinet closed at $174.1, just above its 50-day average of about $172 and below its 20-day average of about $182, after a rally that began in early May. An after-hours price near $129 would break well below both averages and take the stock back toward its early-June levels.
Valuation and Sentiment Were Already Stretched
Investing.com adds some context on positioning. It reports that 30 of 44 analysts rated the stock hold or sell before the report, that JPMorgan has an underweight rating and that Arete Research downgraded the stock to sell a week earlier. It also notes that insiders sold more than $36 million of shares in the previous 90 days. Investing.com mentions reports of a cyber breach circulating after the close as a possible contributor to the drop, but it did not confirm them, and I have found no confirmation from Fortinet, so I would not treat that as fact.
A Sector-Wide Shiver
The selloff spilled into peers. SiliconANGLE reports that Palo Alto Networks, CrowdStrike and Zscaler fell 6% to 7% after hours, and Tenable dropped more than 5% despite beating estimates and guiding fourth-quarter earnings above consensus. Gen Digital went the other way, rising almost 6% on better-than-expected results and a higher revenue outlook. The divergence suggests investors are rewarding consumer-facing security names with steady guidance and punishing enterprise names where the growth narrative has priced in a lot.
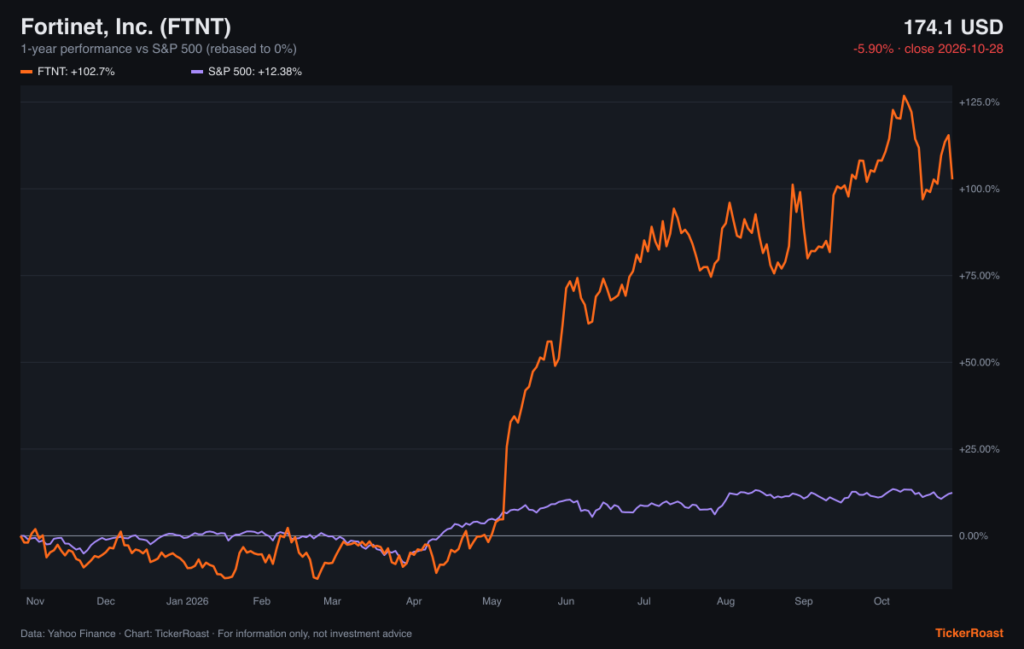
The second chart compares Fortinet’s one-year performance with the S&P 500 through Wednesday’s close and shows how much of a gap the stock had built before the report: Fortinet was up about 103% over 12 months against roughly 12% for the index, with almost all of the outperformance coming after early May.
The next data point will come at BMO’s technology conference on Nov. 12, where Fortinet’s management is scheduled to present. What I want to hear is whether the service revenue trim reflects timing, as some coverage suggests, or a real shift in how customers buy security subscriptions. With billings guidance raised for the third time this year, the demand picture is still strong; the question is how much of it shows up as recurring revenue.
Sources
- Fortinet Reports Strong Third Quarter 2026 Financial Results — Fortinet (SEC filing)
- Fortinet second quarter 2026 financial results — Fortinet (SEC filing)
- Fortinet plunges 26% after-hours and takes Tenable with it as Gen Digital rises — SiliconANGLE
- Why is Fortinet stock plunging today? — Investing.com
- Stock Market Today Live October 28, 2026 — Stock Titan
Market data: Yahoo Finance, close of 2026-10-28. Charts generated by TickerRoast from this data.
Disclaimer: This article is for informational and educational purposes only. It provides general financial and business analysis and does not constitute investment advice, a personal recommendation, a recommendation to buy, sell or hold any security, or an offer to transact in any financial instrument. Information is based on publicly available sources as of October 29, 2026 and market data as of the 2026-10-28 close (Yahoo Finance). Past performance is not a reliable indicator of future results; forecasts are uncertain and actual results may differ materially. Investing in shares involves risk, including the loss of capital. The publisher does not guarantee the accuracy or completeness of the information and accepts no responsibility for investment decisions made on the basis of this article. Readers should consult official company disclosures, conduct their own research and, where appropriate, seek advice from a licensed financial adviser. Any relevant financial interests held by the author or publisher in the securities mentioned are disclosed where applicable. This article was prepared with the assistance of AI tools and is based on the sources listed above.
Anonymous reader poll, just for fun. Not investment advice.
Read next
Get the daily market briefing
The stories that move markets, in your inbox every trading day at 9 a.m. ET. Free, unsubscribe anytime.